Data Warehousing

Empower Your Business with Scalable Data Warehousing Solutions
Data visualization helps you identify patterns so you can mitigate risks, streamline your operations and find new opportunities. However, many organizations lack the knowledge and resources to drive maximum value from their visualizations.
Without the right skills and tools, you will have difficulty optimizing your dashboards and providing teams with the accurate, real-time insights they need when making critical decisions.
Transform Data into Decisions for Strategic
Business Growth
Accelerate Decision-Making
Visualized data converts complex data sets into actionable insights, accelerating informed decision-making that keeps your company ahead of the competition.
Enhance Understanding
Simplify the interpretation of intricate data patterns and trends. Our intuitive visual tools help you grasp the nuances of your business environment, for more effective strategic planning.
Identify Opportunities and Risks
Digestible data formats highlight opportunities and risks, allowing you to proactively adjust your strategies for maximum benefit.
Improve Reporting and Communication
Create compelling, easy-to-understand reports for stakeholders, ensuring alignment and informed decision-making.
Drive Operational Efficiency
Discover inefficiencies and areas for improvement, leading to cost reduction and enhanced productivity.
Receive Customized Solutions
Our data visualization tools are tailored to meet the unique needs of your organization, ensuring relevance and maximum impact for your specific industry challenges.
Collaborate Seamlessly
Foster teamwork by sharing information and reports, facilitating timely, informed decisions through intuitive data sharing and visualization.
Leverage Accurate Insights
Eliminate manual processes and reporting errors with clean data, providing a single source of truth for enhanced business intelligence (BI) through sophisticated visualizations.
Trust Your Data, Unite Your Sources
Integrate diverse data sources into a trustworthy platform, ensuring data integrity and a coherent, dependable view for decision-making.
Save Time and Costs, Become Self-Sufficient
Streamline data analysis, enabling your team to generate reports and insights independently, reducing reliance on external resources and enhancing self-sufficiency.
Empower Your Organization with
On-Demand, Clear Data Visualization
Unlock Instant Insights
Receive Expert Guidance
Tailored Visualizations
Collaborative Refinement
Compelling Storytelling
Seamless Integration
Embrace Data Visualization at Scale
Elevate Your Data Warehouse with Us
1
Plan
2
Prototype
3
Build and Test
4
Deploy
Data Mastery at Your Fingertips: Empowering Informed Strategies
Unified Data Solutions
Harmonize your data journey, unifying information into reliable, reusable datasets for instant, impactful insights.
User-Friendly Analysis Tools
Navigate your data effortlessly in our user-friendly environment, unlocking intuitive analysis for swifter, informed decision-making.
Customized Reporting Excellence
Craft visually captivating reports tailored to your needs, aligning perfectly with business objectives for enhanced understanding and engagement.
Unlock Insights, Boost Productivity and
Slash Costs with Self-Service
Business Intelligence

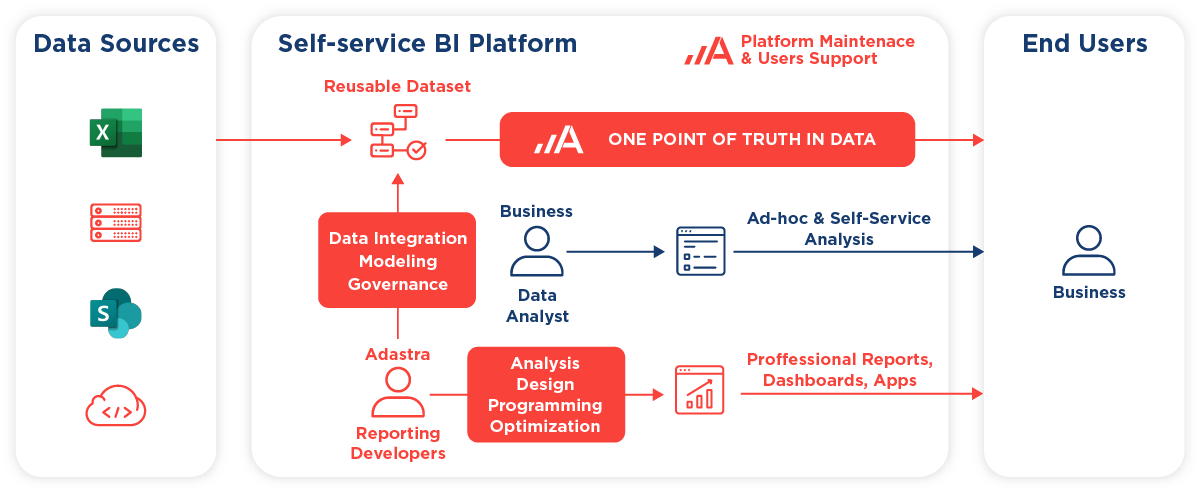
100+ customers trust us with projects on self-service BI platforms, enabling faster decision-making, cost savings, enhanced collaboration, reduced dependency on IT, and more.
Transform your data management with ease and save your organization time with automated monthly reporting.
We support you to:
Create a unified, “single source of truth” for your data
Craft professional and optimized reports, dashboards and applications
Set up data governance and maintain the platform
Educate business users and data analysts on optimal use
Optimized BI Reporting for Every Level of
Expertise
End-User Simplicity
For managers, executives, and end users, our solutions offer automated reporting and dashboards with scheduled refreshments, ensuring timely access to insights without complexity.
Empowered Business Analysts
Intermediate users like business analysts benefit from our curated datasets and advanced visualization tools, tailored for impactful analysis with minimal effort.
Advanced Support for Experts
Data scientists and BI experts can access our full suite of advanced analytics, data modeling, and ad-hoc reporting tools to drive deep, predictive insights.
Success Story
Data Warehouse Solution in the Azure Cloud
A North American utility company spent countless hours collecting, curating, and cleaning data to prepare it for reporting.
We built a Data Warehouse solution in Azure Cloud that serves as a single source of truth and turns data into actionable insights.
8x
faster regulatory reporting
100%
leaned and governed data
1
source of truth for all data
Success Story
Data Warehouse Solution in the Azure Cloud
40
excel files to sort each month
12+
redesigned Power BI reports
10
newly-developed reports

